We recently published a paper on developing synthetic fjord bathymetry in the absence of observations. Before giving a summary of the paper, lets cover some background which may answer questions such as “why is synthetic bathymetry required”, “why not just provide real bathymetry” or even “why make it up?”
Some background - isn’t everything mapped already?
With high resolution imagery now more available than ever (e.g. Google Earth) and with mapping agencies such as the Ordnance Survey here in the UK providing excellent high resolution maps, one might think that the globe had already been mapped and there wasn’t much that we didn’t know. Globally this is not the case. The more time one spends working with spatial data, the more apparent the gaps in our high resolution image of the world we live in become. Bathymetry (topography under water) is one such area for which data are not available to provide high resolution global coverage. This is precisely why we are still mapping the ocean floor (e.g. GEBCO, IBCAO) and why new versions of the datasets are being released through time. Many fjords have been mapped, with some of them having been mapped in great detail. However there remain thousands of fjords that have no information at all.
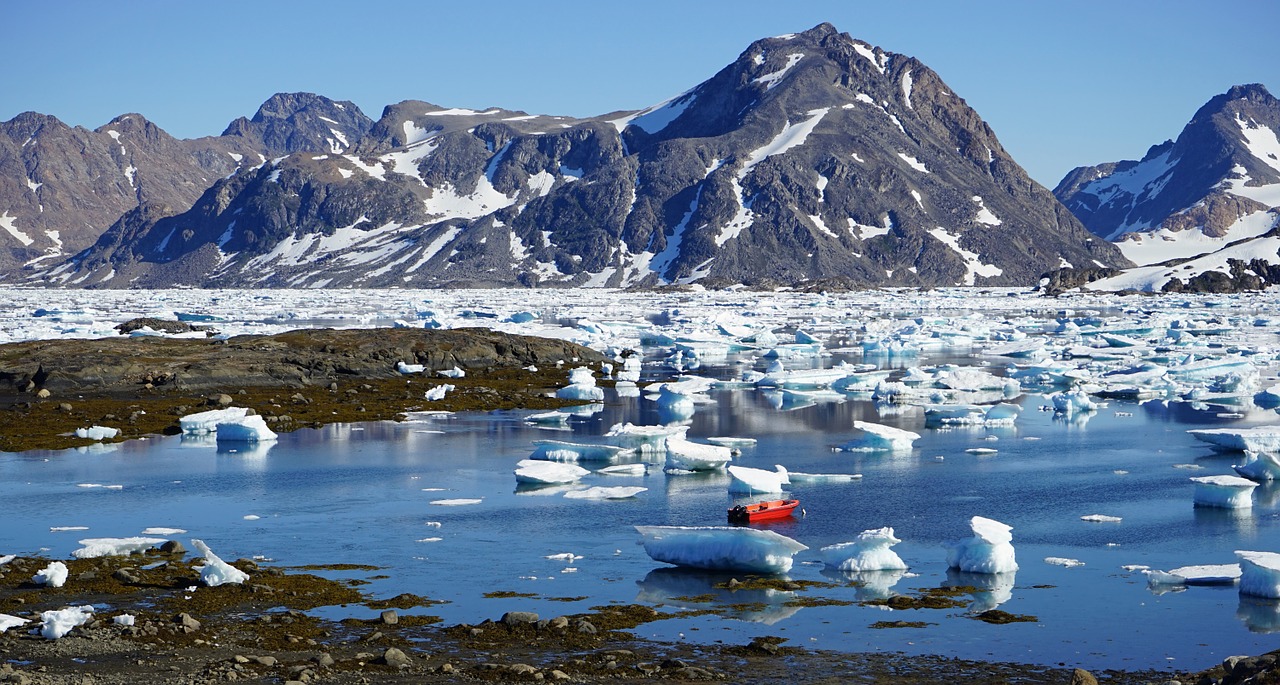
Let’s start with a picture of a fjord in Greenland (source) - those icebergs you see make sailing a boat along the fjord to map the fjord bottom a little bit tricky…
Creating an elevation surface
Collecting observations to cover every point across the earth is both time consuming, expensive and sometimes not even possible with current technologies. This means that some areas - whether on land or below the ocean - never actually get specifically surveyed. The surface or “topography” one sees when looking at a map is the result of a multiple stage process. For a given region:
- Point elevation measurements are taken across an area
- A continuous surface is developed from the point measurements
Point elevation measurements can be acquired from the Earth’s surface using various tools and techniques from traditional ground based survey levelling to the use of airborne or satellite approaches including LiDAR or even gravity inversion techniques. Bathymetry can be measured using some of these tools along with other techniques including the use of tools including multibeam echosounding. Look here for some excellent videos uploaded by NASA showing the use of various tools to measure the bathymetry of a fjord.
From these points, a continuous surface can then be created from points by passing a mathematical surface through them - this “surface” can be envisaged as a chess board type grid where each square is assigned an elevation. There are many approaches that can be applied to create the surface - one approach can be the use of averaging where the elevation for a specific grid cell is the result of taking the mean of all point observations that fall within the square’s area. A more detailed description of gridding (from the prospective of programming) is presented here. The gridding process (adapted from here) is illustrated below, with the points falling within each grid cell being displayed:
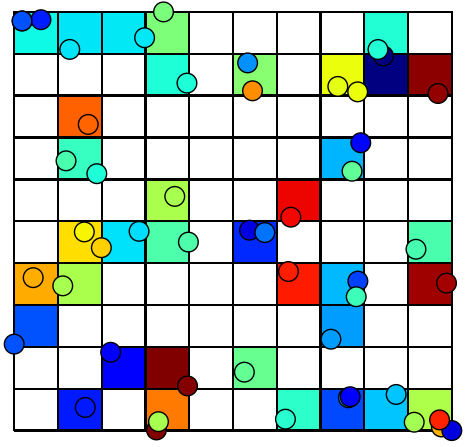
As you will see, there are many grid squares in the image above for which there are no points, and the squares remain empty. This is a situation that is often met by map makers and those working with geospatial data and is due to gaps in the observational data record. To assign these locations with a value, using interpolation such as spline or kriging is required. Kriging enables the prediction of values in regions where data are unavailable by using a statistical model that takes into account known point observations. An example of an interpolated surface constructed from sparse observation points using spline interpolation is illustrated below:
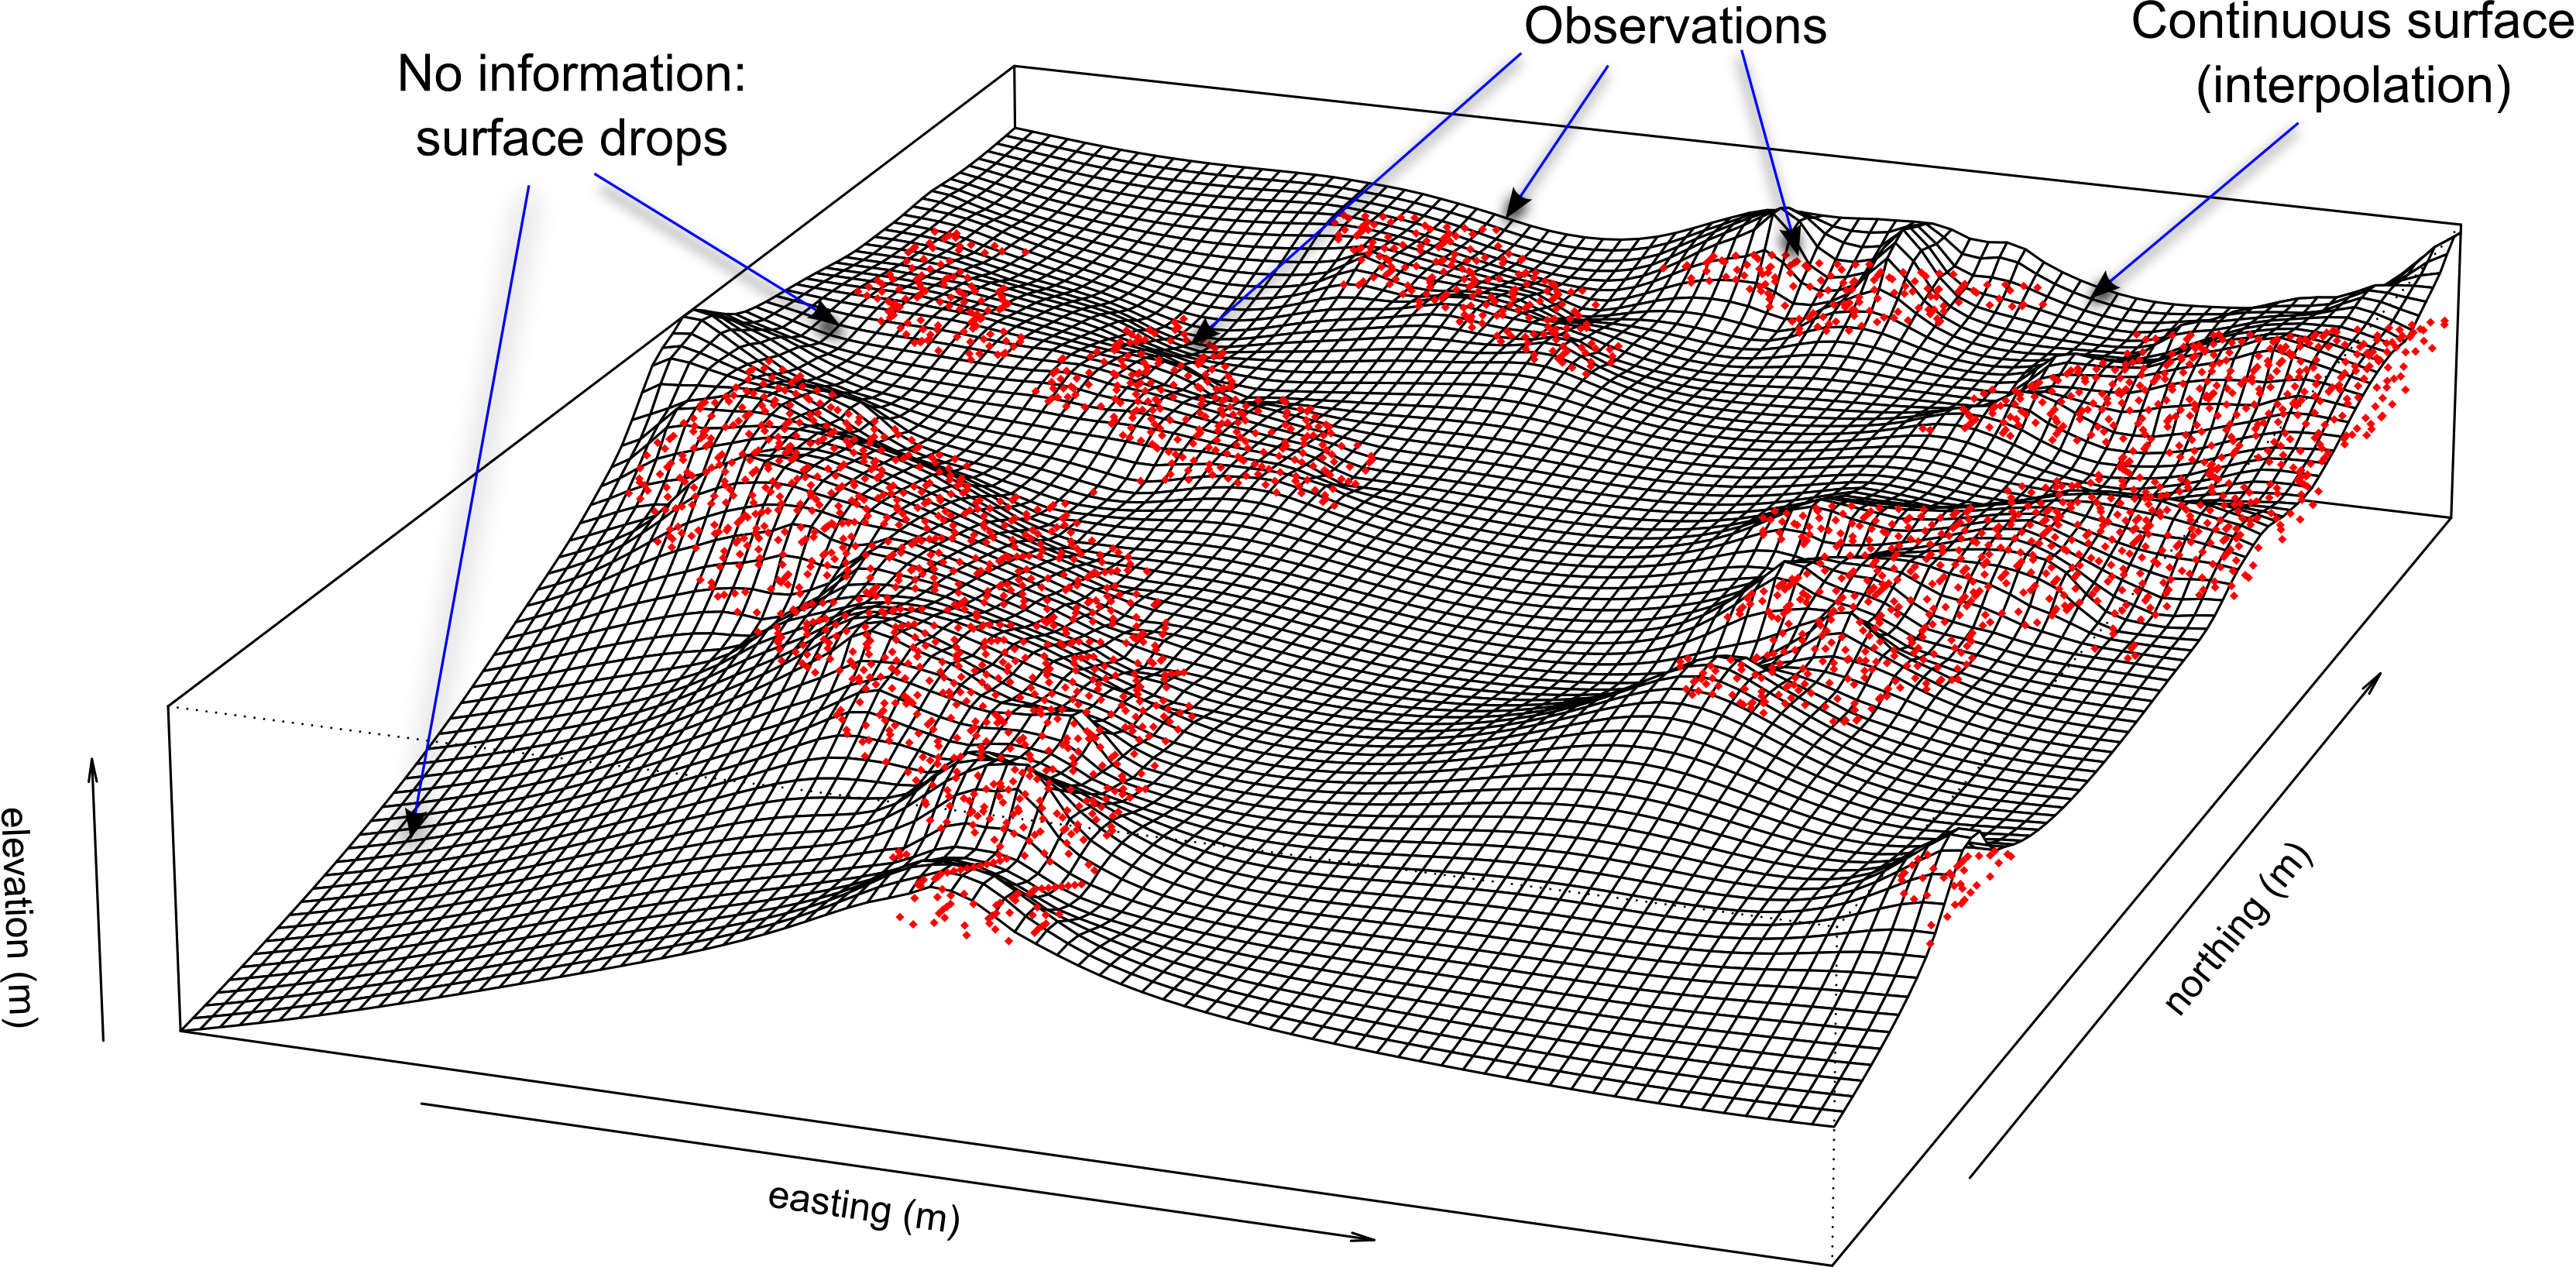
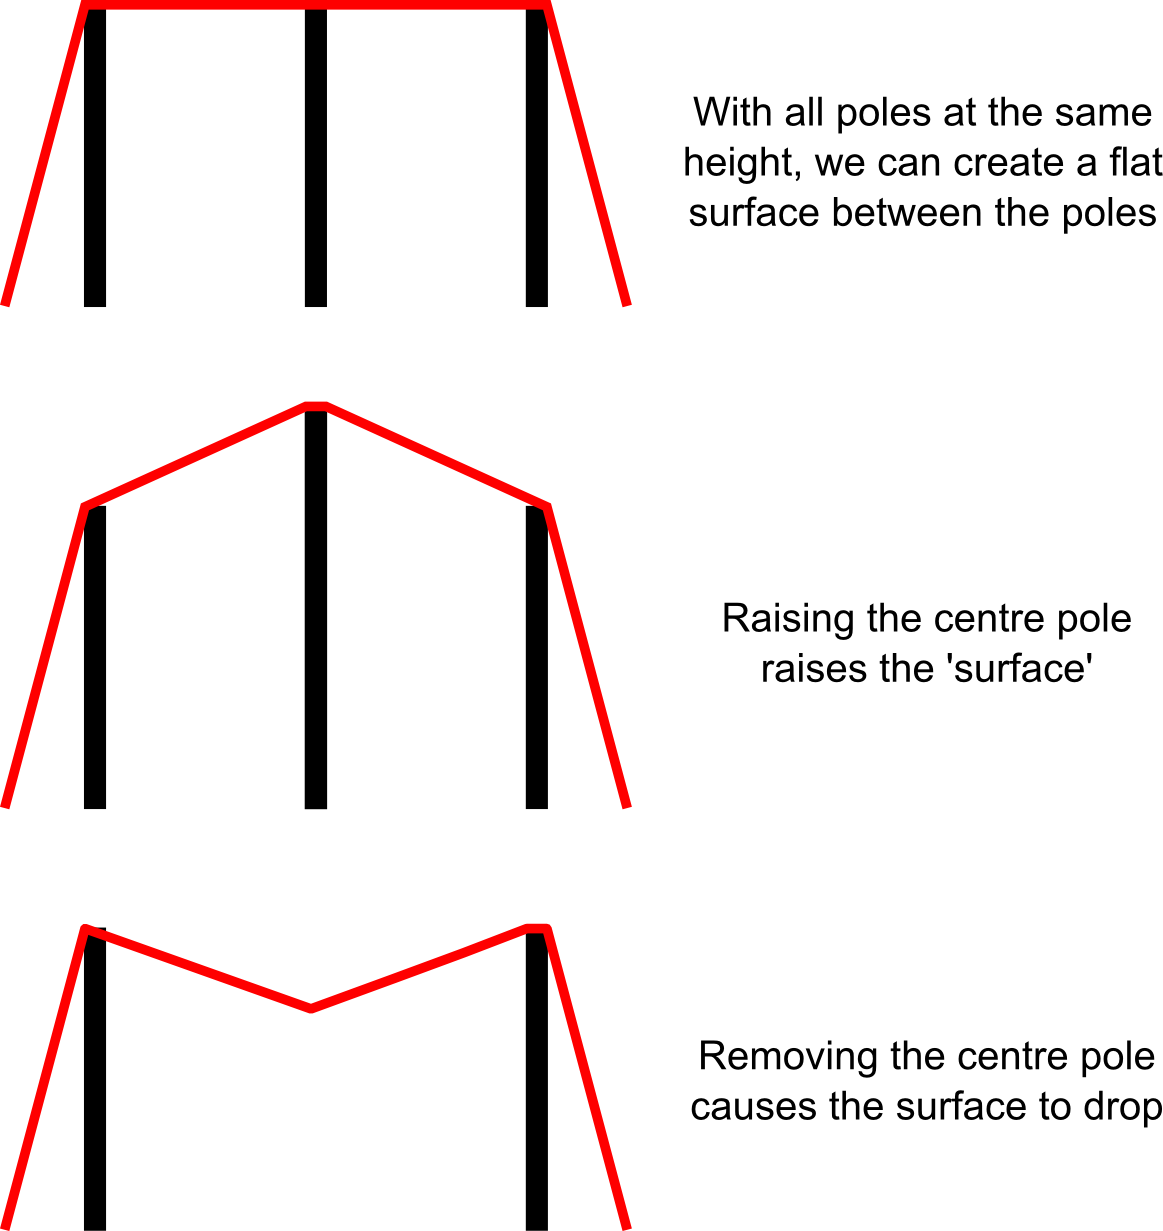
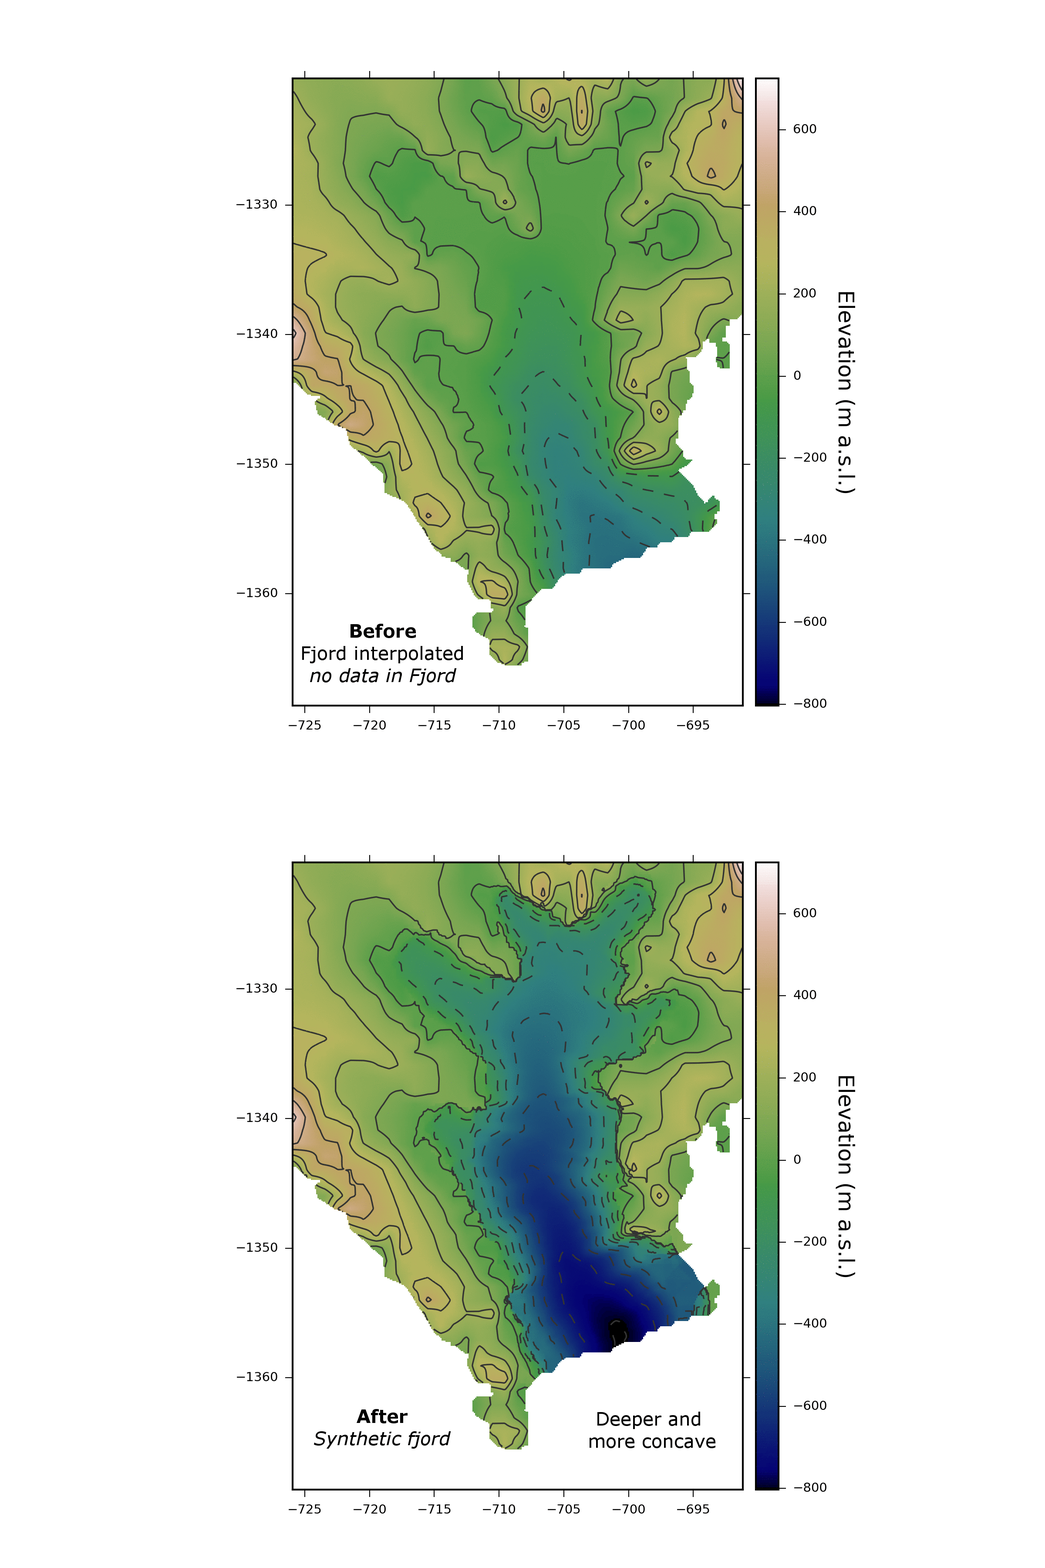
The use of interpolation methods can create surfaces that match the real topography or bathymetry (i.e. what you can see in “real life”) where the available measurements are descriptive of the overall surface. Problems arise however where the observations available do not adequately describe the surface that we are trying to map. This was a problem with past maps of Greenland. There were observations for the exposed ground and even beneath the ice sheet (see Bed2013) but no observations in the fjords. When trying to use the elevations of the land surrounding the fjords to predict what the fjords likely look like, we started to run into problems. By simply interpolating the data to cover the fjord regions, the resultant elevation surface often appeared deeper (or lower) where one would expect fjords to be. This may seem like a good start but the reason we were getting fjord-like bathymetry was as a result of having no information as opposed to any intelligent process-driven process. Another way to think about this would be by setting up a tent with two poles at the edges and a pole in the middle, holding the fabric up. Each pole is the equivalent of an elevation observation. Each pole at the tent edges represents an observation take on the land. If we take the pole away from the middle of the tent, then the fabric sags in the middle - in 2D this appears as a drop in elevation - this ‘sag’ alone was our representation of bathymetry.
What we did
As we know that we have fjords in glacier regions, even though we have no observed elevations, we understand the processes required to create them (glaciologically or geomorphologically). By considering other fjords and their terrestrial counterparts (u-shaped valleys) we could estimate the geometry that fjords might likely take. The method presented in our paper first maps the fjords and then takes in to account land-formation process knowledge by imposing a u-shaped structure to each fjord, with fjords being identified using satellite imagery. Essentially, our approach provides each fjord with an idealised skeleton which provides a foundation from which we can create an elevation surface.
The elevations of the bathymetry were estimated by considering the nearest observations at the head and mouth (or start and end) of a fjord, and inducing a sloping profile. This is a simple realisation of a land-feature but is as much as can be done to best approximate fjord bathymetry until more data become available - a process that is very much under way e.g. NASA’s Oceans Melting Greenland project. Demonstrating our approach below, we can see the predicted elevation surface for part of Greenland before and after using the method. You’ll notice that using our approach, the fjords are deeper and more concave. For more information on the method, have a read of the paper which is freely available.
Why bother?
Knowledge of bathymetry in unmapped regions is not just interesting - it is essential to understand the processes that change our world. Oceans and currents are known to effect the rates of change of glaciers (have a read here). To understand how ocean current interact with glaciers - an understanding achieved through use of ocean circulation models - it is essential that the bathymetry is represented as accurately as possible. In the absence of data, our method provides a mechanism with which to enable this. This is also essential to consider when studying how glaciers move from their present day positions out into the fjords and the impacts that the bathymetry can have on processes such as the formation of icebergs through calving.