Create random points based on a regular grid
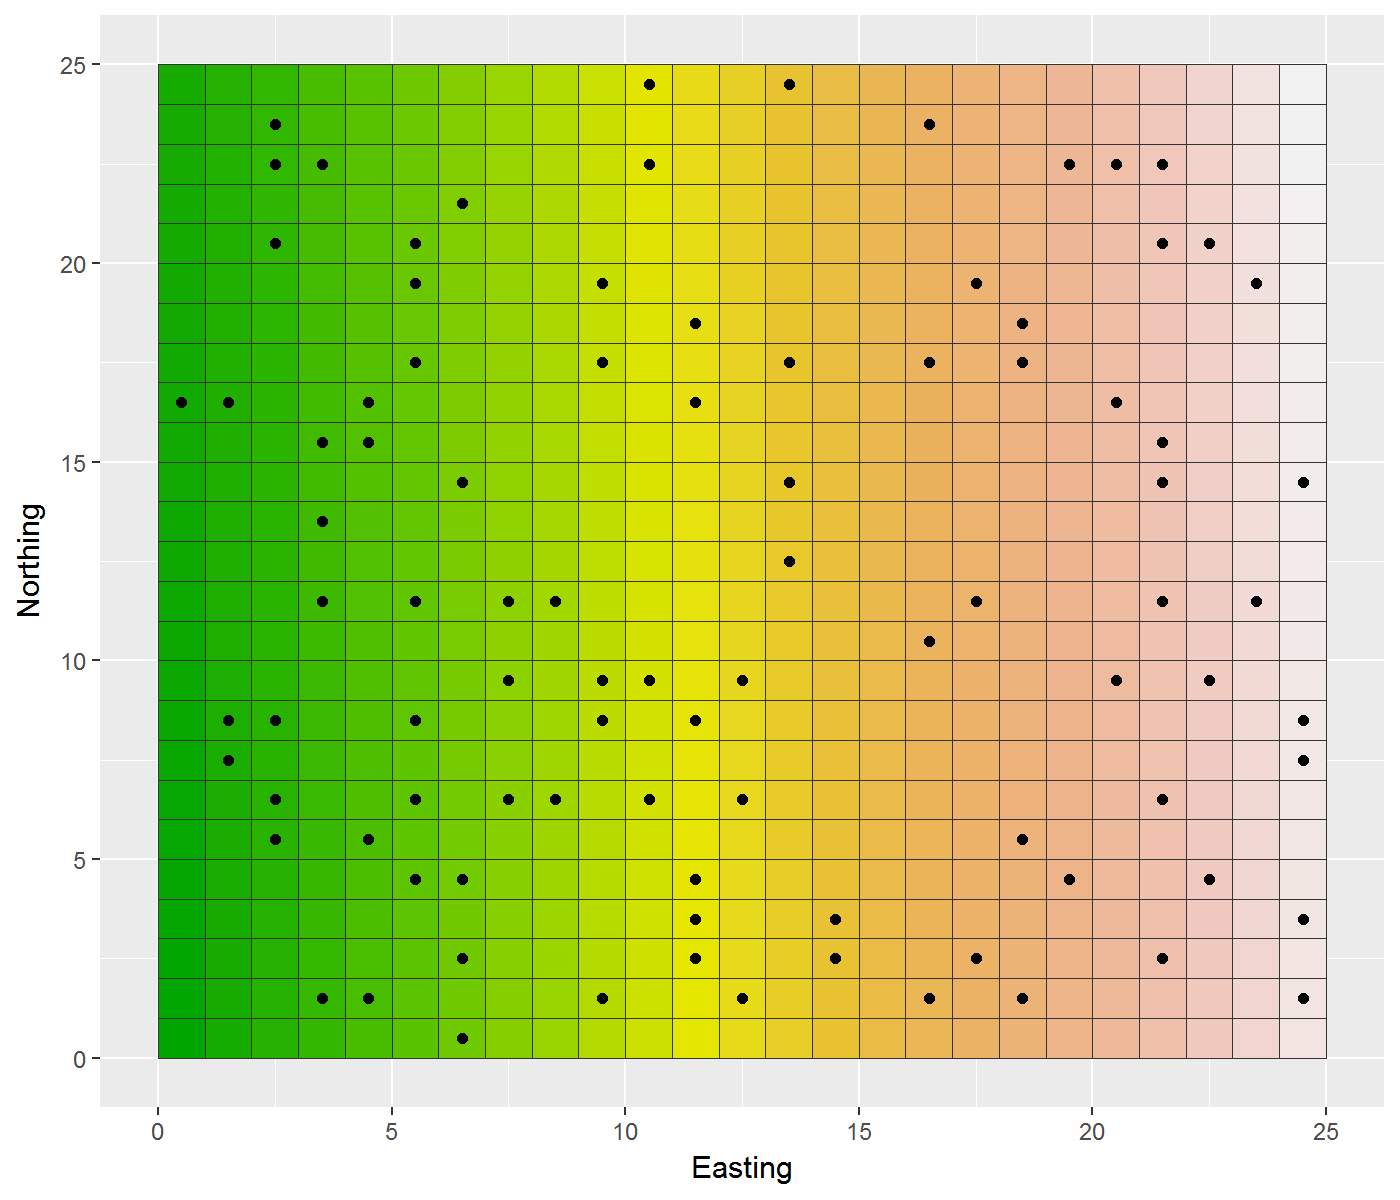
Aim: Create 100 random points based on the cell centre coordinates of a regular grid
Using R, the way we’ll go about it is:
- Create a grid using the
rasterpackage to a given extent - Extract the cell centre coordinates of each cell
- Randomly select x,y coordinate pairs until we have the number of samples we want
- Write them to file
There will then be a bonus level which involves plotting the result where we’ll use ggplot2.
library(raster)

# Setup some output file names
fout="random_points__CELL_CENTRES.csv"

# Define extent
xmin=0
ymin=0
xmax=25
ymax=25
aoi_extent=extent(xmin, xmax, ymin, ymax)

# Create grid and get xy coordinates from which toi extract these random points)
rast <- raster(ext=aoi_extent, resolution=1)
values(rast)= 1:ncell(rast) # give raster cells a value

# Extract cell centre coordinates
x_centres=xFromCol(rast)
y_centres=yFromRow(rast)

# Select some random points
random_point_count=0
random_point_sample_number=100 # the number of points you want

while (random_point_count < random_point_sample_number){

	easting_random=sample(x_centres, 1)
	northing_random=sample(y_centres, 1)

	if (exists("random_points")==TRUE){
		# random_points dataframe already exists
			random_points=rbind(random_points,
						c("EASTING"=easting_random,
						  "NORTHING"=northing_random))
		} else {
			# random_points dataframe doesn't exist yet...")
			random_points=data.frame("EASTING"=easting_random,"NORTHING"=northing_random)
		}

	random_point_count=random_point_count+1
}

# Write random points to file
write.csv(random_points, fout, row.names=FALSE)
Great. Now let’s plot it up - this is based on a couple of stackoverflow posts on the tile plotting here and the coordinate shift here:
library(ggplot2)
library(reshape2)

# Setup some output file names
plot_out="random_points__CELL_CENTRES.png"

# Convert raster to matrix
mat=as.matrix(rast)
dat = melt(mat)

# Shift over the easting (now Var1) and northing (now Var2) values by half a pixel (ggplot uses coordinates as mid-points, whereas we want it to plot from the mid-point minus half a pixel length or width)
dat$Var1=dat$Var1-0.5
dat$Var2=dat$Var2-0.5

p = ggplot(dat, aes(x=Var1, y=Var2)) +
	 geom_tile(aes(fill=value), colour="grey20") +
	 scale_fill_gradientn(colours = terrain.colors(10)) +
	 geom_point(data = random_points, mapping = aes(x=EASTING, y=NORTHING), colour="black") +
	 labs(x="Easting", y="Northing") +
	 theme(legend.position="none")

ggsave(plot_out, plot=p, height=6, width=7, dpi=200)
And you should have this:

Written on March 13, 2018