Tidy line of 2D array plots each with a colorbar
This is something I keep coming back to and first posted about a while ago here.
Let’s say we have three 2D arrays - we want to plot them in a line, each with a colorbar that is the same height as the plot and which doesn’t overlap neighbouring the sub plot.
Let’s import a couple of libraries and make some arrays.
import numpy as np
import matplotlib.pyplot as plt

# Make some 2D arrays of random values
ar1=np.random.rand(9,9)
ar2=np.random.rand(9,9)
ar3=np.random.rand(9,9)
Now, let’s make a first effort at plotting them using subplots:
# Crude first plot
plt.subplot(1, 3, 1)
plt.imshow(ar1)
plt.title("Input\n")
plt.colorbar()
plt.subplot(1, 3, 2)
plt.imshow(ar2)
plt.title("Noise\n")
plt.colorbar()
plt.subplot(1, 3, 3)
plt.imshow(ar3)
plt.title("Input plus noise\n")
plt.colorbar()
plt.show()

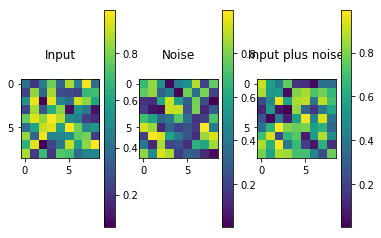
Hmmm, not ideal. We need to make separate axis for the colorbars and make sure the overlaps are removed. We need a new import for this:
from mpl_toolkits.axes_grid1 import make_axes_locatable
To make a colorbar axis, we can create the following function which takes in an axis object which we didn’t even create in our first attempt above:
def make_colorbar_with_padding(ax):
    """
    Create colorbar axis that fits the size of a plot - detailed here: http://chris35wills.github.io/matplotlib_axis/
    """
    divider = make_axes_locatable(ax)
    cax = divider.append_axes("right", size="5%", pad=0.1)
    return(cax)
Now, let’s try and rebuild our plot - this time using specific fig and ax objects.
fig=plt.figure()
Now let’s add a subplot for each array whilst also calling the make_colorbar_with_padding() we made above:
ax1=fig.add_subplot(131)
plt.imshow(ar1)
plt.title("Input\n")
cax1=make_colorbar_with_padding(ax1) # add a colorbar within its own axis the same size as the image plot
cb1 = plt.colorbar(cax=cax1)

fig.subplots_adjust(right=0.9)#2 # shift subplots to the right to make space for the colorbars using the function [subplots_adjust()](https://matplotlib.org/api/_as_gen/matplotlib.pyplot.subplots_adjust.html)

ax2=fig.add_subplot(132)
plt.imshow(ar2)
plt.title("Noise\n")
cax2=make_colorbar_with_padding(ax2)
cb2 = plt.colorbar(cax=cax2)

ax3=fig.add_subplot(133)
plt.imshow(ar3)
plt.title("Input plus noise\n")
cax3=make_colorbar_with_padding(ax3)
cb3 = plt.colorbar(cax=cax3)

plt.show()
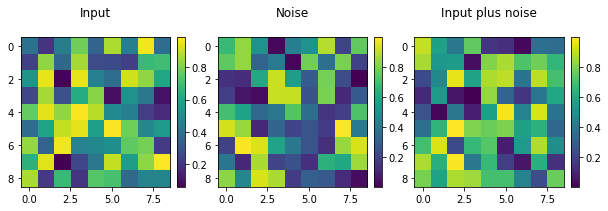
Now we end up with this which looks much better:

Don’t forget that you can play around with the amount of padding and also that the amount you adjust you subplot spacing is related to the size of the figure.
Download the python script here.