Centre a diverging colorbar at a defined value with matplotlib
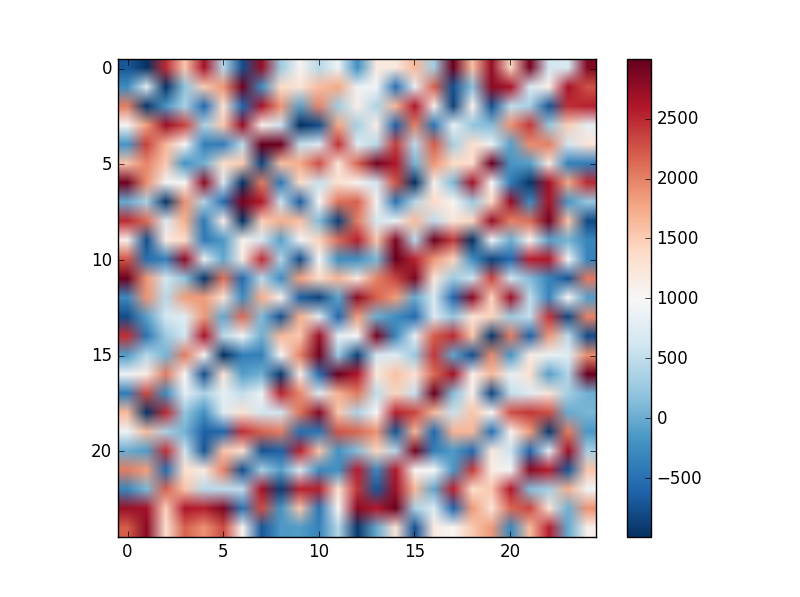
With raster datasets, I often find myself using diverging colour scales. For a dataset ranging from say -3000 to 1000, we might want a colorbar to diverge from 0. By default though, any colorbar applied in matplotlib will diverge from the midpoint between -3000 and 1000 i.e. -1000. This isn’t so useful. There is help at hand though as documented here. For a quick example with matplotlib’s imshow, lets first make some data and plot it
import matplotlib
import matplotlib.pyplot as plt
import matplotlib.colors as colors
import numpy as np

# create an array of random vlues - you might read in a raster dataset
x=25
y=25
ras=np.random.randint(-1000,3000,size=(x*y)).reshape(x,y)
cmap=matplotlib.cm.RdBu_r # set the colormap to soemthing diverging
plt.imshow(ras, cmap=cmap), plt.colorbar(), plt.show()
The plot and colorbar will look like this:

Not super useful. However, Joe Kington created this handy class:
# set the colormap and centre the colorbar
class MidpointNormalize(colors.Normalize):
	"""
	Normalise the colorbar so that diverging bars work there way either side from a prescribed midpoint value)

	e.g. im=ax1.imshow(array, norm=MidpointNormalize(midpoint=0.,vmin=-100, vmax=100))
	"""
	def __init__(self, vmin=None, vmax=None, midpoint=None, clip=False):
		self.midpoint = midpoint
		colors.Normalize.__init__(self, vmin, vmax, clip)

	def __call__(self, value, clip=None):
		# I'm ignoring masked values and all kinds of edge cases to make a
		# simple example...
		x, y = [self.vmin, self.midpoint, self.vmax], [0, 0.5, 1]
		return np.ma.masked_array(np.interp(value, x, y), np.isnan(value))
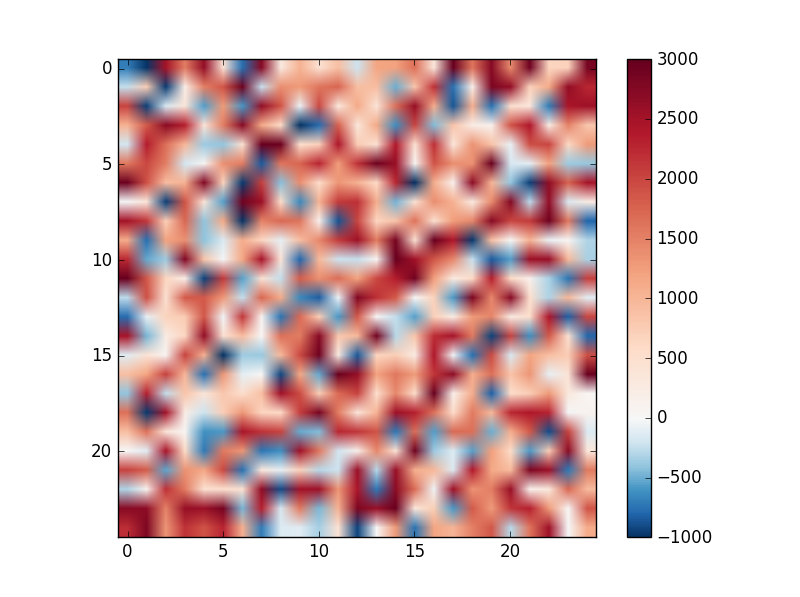
This maps minimum, midpoint and maximum values to 0, 0.5 and 1 respectively i.e. forcing the middle of the scale bar to match your midpoint. You can now call this in your imshow call like this:
elev_min=-1000
elev_max=3000
mid_val=0

plt.imshow(ras, cmap=cmap, clim=(elev_min, elev_max), norm=MidpointNormalize(midpoint=mid_val,vmin=elev_min, vmax=elev_max))
plt.colorbar()
plt.show()
And now you’ll have a more useful plot and colorbar:
