Converting csv files to ESRI Shapefile format
The ability to visualise csv files within a GIS usually requires a couple of steps if you are operating your GIS in a point and click fashion. This is fine for a couple of files, but where you have multiple csv files, this takes / wastes a lot of time. The conversion of csv files to (projected) vector files (here we’ll use ESRI Shapefile format) can be automated using GDALs ogr2ogr library.
First off, make sure you have gdal on your machine, otherwise download a copy and install it.
Now, save this file called sample_xy.csv in a known directory on your machine.
The file contains xy points and looks like this:
x,y
-438636.284516,-1952095.8109
-438803.770221,-1952224.32721
-438971.255926,-1952352.84351
-439138.741631,-1952481.35981
-439306.227336,-1952609.87611
-439473.713041,-1952738.39241
-439641.198747,-1952866.90872
-439808.684452,-1952995.42502
-439976.170157,-1953123.94132
-440143.655862,-1953252.45762
Creating a shapefile requires a few steps - these can be wrapped and implemented in python but we’ll leave that for another day.
Create a dbf file
Working on the command line where GDAL is available, in the same directory as you have saved sample_xy.csv, create a dbf file using:
ogr2ogr -f "ESRI Shapefile" sample_xy.dbf sample_xy.csv
Notice that sample_xy.dbf is the destination file and sample_xy.csv is my input file. After running the above command, check that sample_xy.dbf exists. The dbf file will be used in the next step to create the actual shapefile.
Create a vrt file
Before we can create our shapefile, we must create a vrt file which describes the shapefile’s geometry type, projection, source data etc. This may seem cumbersome, but can be automated eventually so stick with it!
In the same directory as sample_xy.csv and sample_xy.dbf, using a text editor, create a new file called sampel_xy.vrt and inside type the following:
<OGRVRTDataSource>
  <OGRVRTLayer name="sample_xy">
    <SrcDataSource>sample_xy.csv</SrcDataSource>
    <SrcLayer>sample_xy</SrcLayer>
    <GeometryType>wkbPoint</GeometryType>
    <LayerSRS>+proj=stere +lat_0=90 +lat_ts=71 +lon_0=-39 +k=1 +x_0=0 +y_0=0 +datum=WGS84 +units=m +no_defs</LayerSRS>
    <GeometryField encoding="PointFromColumns" x="x" y="y"/>
  </OGRVRTLayer>
</OGRVRTDataSource>
The layer will be called sample_xy. We have specified where the data is coming from between the SrcDataSource tags as being sample_xy.csv, specified the geometry to be of point type using wkbPoint, have set the projection using a Proj.4 string (you can use EPSG codes too if you prefer - just make sure it matches the projection of the points in the csv). Finally, notice that we have set the x and y column headers under GeometryField encoding to "x" and "y".
Create the shapefile
With our sample_xy.vrt file, we can now create the shapefile by using ogr2ogr as follows:
ogr2ogr -f "ESRI Shapefile" sample_xy sample_xy.vrt
This will put all of the files associated with the shapefile into a new directory called sample_xy (note that the last argument about of sample_xy.vrt is our input). You can change this output location as you wish.
If you now go into the sample_xy directory, you should see 4 files: sample_xy.dbf, sample_xy.prj, sample_xy.shp, sample_xy.shx
Open in a GIS
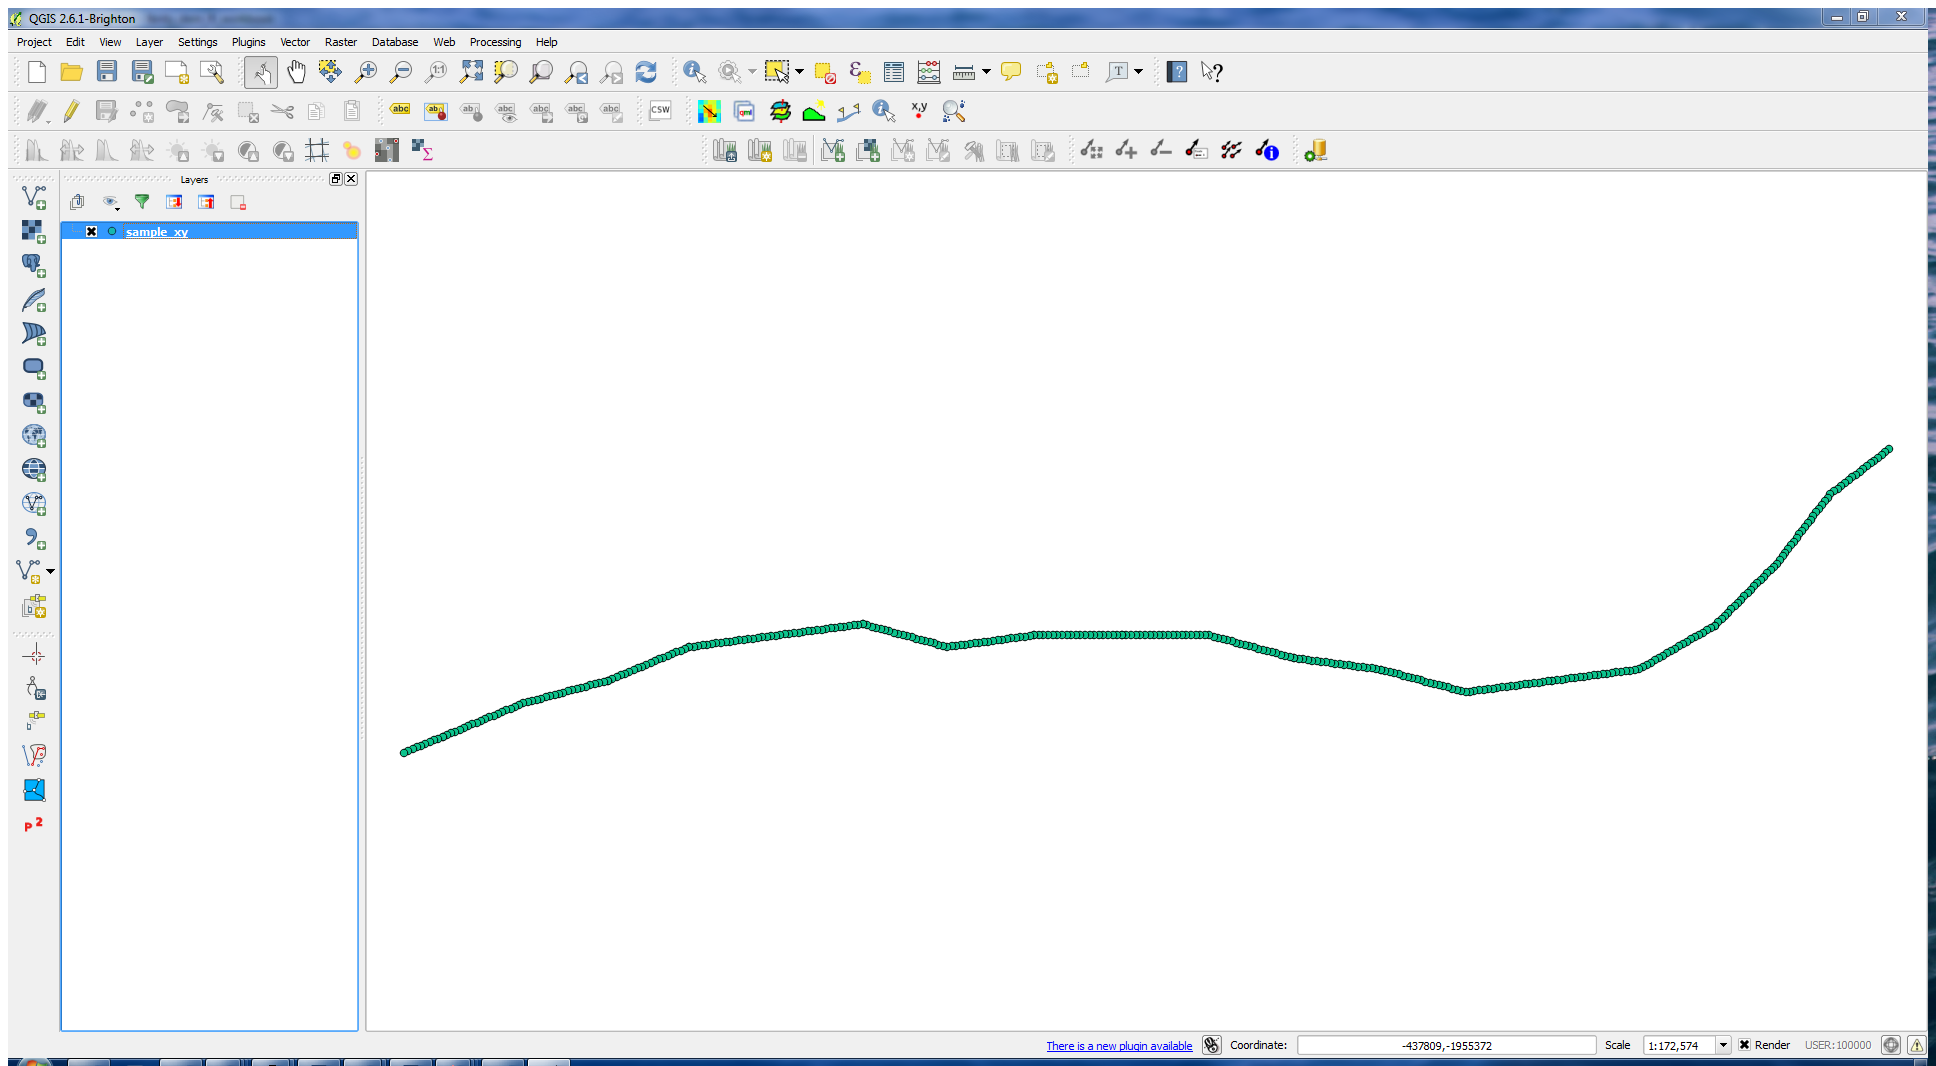
Now go to your favourite GIS, add the shapefile you’ve created and you should see this:

If you check the metadata of the file, you should also see that the projection as set in the sample_xy.vrt has carried over.
More ogr help…
Take a look here.