Python for data analysis
Andrew Tedstone, October 2016
Python has evolved to be a great platform for data analysis. There is a whole ‘ecosystem’ or stack of packages which together provide a comprehensive toolkit for most kinds of data analysis.
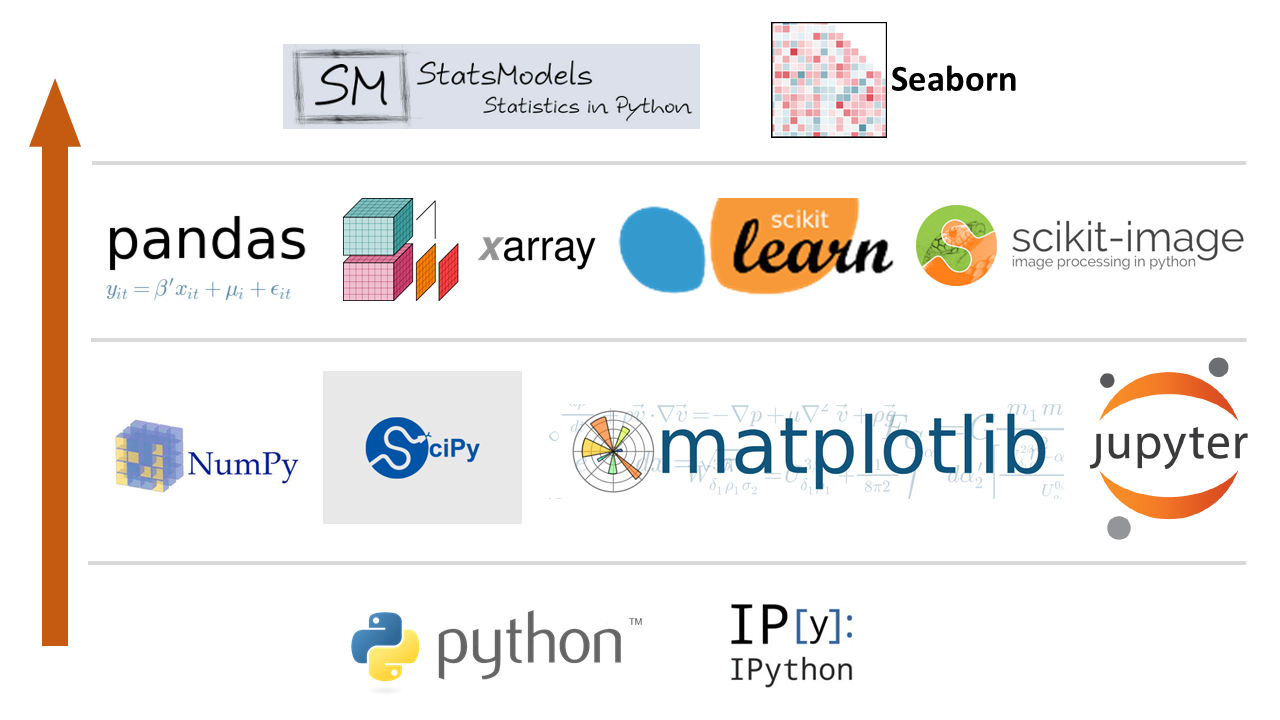
During the Beginner and Intermediate courses we have just been using the two things on the bottom row of our stack: Python and IPython.
The basic building blocks
The real power of Python for data analysis comes when we move up a row. Numpy, SciPy, Matplotlib and JuPyter notebooks are the fundamental building blocks for your data analysis scripts:
-
NumPy: provides N-dimensional numerical arrays (or matrices in MATLAB speak), linear algebra, Fourier transforms. See the course tutorial for more information.
-
SciPy: builds closely on NumPy, providing more advanced numerical methods, integration, ordinary differential equation (ODE) solvers…if you’ve come across the booked called ‘Numerical Recipes’, there’s a good chance that you’ll find those algorithms implemented in SciPy.
-
Matplotlib: Python’s main graphing/plotting library. Make all the pretty plots. The documentation on the Matplotlib website is good, especially the gallery. See the course tutorial for a short introduction. All the packages on this page with plotting capabilities rely on Matplotlib under the hood.
-
JuPyter: rather than using the interactive IPython command line, you might want to use Python in a ‘notebook’ style from inside your web browser, which keeps your commands and their outputs together in a single document that you can re-open later on. Particularly worth looking into if you do a lot of statistics.
Analysing and manipulating your data
Increasingly, some combination of the packages on the next row up - Pandas, xarray, scikit-learn and scikit-image are essential to the day-to-day work of a data scientist.
-
Pandas - Number-one most important tool for data science. High-performance data structures and data analysis tools. Takes a whole load of complexity out of loading tabular data into Python for analysis, especially CSV files, Excel files, SQL databases… Labels your data nicely with column headings and indexes. Does lots of basic statistics and offers plotting facilities to quickly take a look at your data. Particularly good if you have to work with time series data. Work through the course tutorial on Pandas.
-
xarray - inspired by Pandas but designed especially to work with N-dimensional data, such as that provided by climate models. Essentially an in-memory representation of a NetCDF file, if you’ve come across those. Again offers inbuilt statistics and plotting for rapidly exploring your data. Either look at tutorials on the xarray website or have a read of a tutorial specifically about using geographic NetCDF files with xarray. If you’re working exclusively with climate data then alternatively check out Iris, which is written by the UK Met Office.
-
scikit-learn - machine learning tools for Python. Increasingly popular, contains all the main algorithms used in this field such as K-means clustering. Check here before deciding that you need to write your own algorithm from scratch!
-
scikit-image - a bunch of functionality for doing image analysis, including for satellite images.
The top level - advanced statistics
-
Statsmodels - provides implementations of all the major statistical algorithms. Preferentially works with Pandas DataFrames. Has the option of using R-like syntax, which you’ll probably like if you’re familiar with R.
-
seaborn: a set of statistical plotting tools. The plots look very elegant. Well worth looking at if you do a lot of statistical work. Takes Pandas DataFrames as standard.
Why are these packages separated into ‘levels’?
In general, the top levels of the stack of packages depend on the packages lower down to make them work. For example, seaborn uses takes in Pandas DataFrames and uses Matplotlib ‘under the hood’ for its plotting.
This also means that you should usually start with the tools or packages at the top of this stack. If you can’t find the function you want then move one level down the stack and search for it there. If you get all the way to the bottom of the stack, i.e. Python/IPython, then you probably have to write your own function - but it’s best to see if someone else has done it for you first, so do a bit of Googling before committing yourself to this.
Last note
This selection of packages is non-exhaustive. A variety of other specialist packages depending on your work are available - for example:
- Spectral Python - for hyperspectral remote sensing
- AstroPy - for astronomy
- PyTables - for working directly with HDF files (note Pandas does this pretty well for the most part)
- Bokeh - for interactive plotting
- Cartopy - for geographic plotting
- Matplotlib basemap - for geographic plotting
- GDAL and OGR - geographic transformations and warping. Fantastic and the gold standard if you can get it to work, expect a bit of a fight but well worth it.
- PySAL - Spatial Analysis Library. Particularly good at spatial econometrics, location modelling…